Why search traffic drops: our own data and a six-step protocol
A client wrote to support: after launching a cascade, traffic eventually dropped. We checked the database — and got an answer more useful than the question. A third of the promoted pages lost impressions, while half of the pages on the same sites over the same dates did. We look at how to tell a real drop from background noise, why two thirds of drops happen without any loss of position, what is actually true about AI results, and give a six-step protocol for finding the cause.
A client wrote to support: after launching a cascade, traffic eventually dropped. We went into the database to check — and got an answer more useful than the question. The cascade had nothing to do with it, and not because we say so, but because a drop on a single page means almost nothing until you know how often it happens on its own. This one is worth reading for anyone whose traffic has ever fallen, which is everyone.
The core move: a number without a baseline is meaningless
The complaint was specific: promotion was launched, time passed, traffic fell. The logic is clear and looks airtight — one event happened, then another followed.
To test it, we took pages that have both a cascade launch and daily Search Console data. For each we counted impressions over the 28 days before the launch and the 28 days after. Then came the step that the whole exercise was for: for the same sites and the same calendar dates we assembled a control group — pages that never had a cascade run on them. If a post-launch drop is caused by the launch, the control group should not show one.
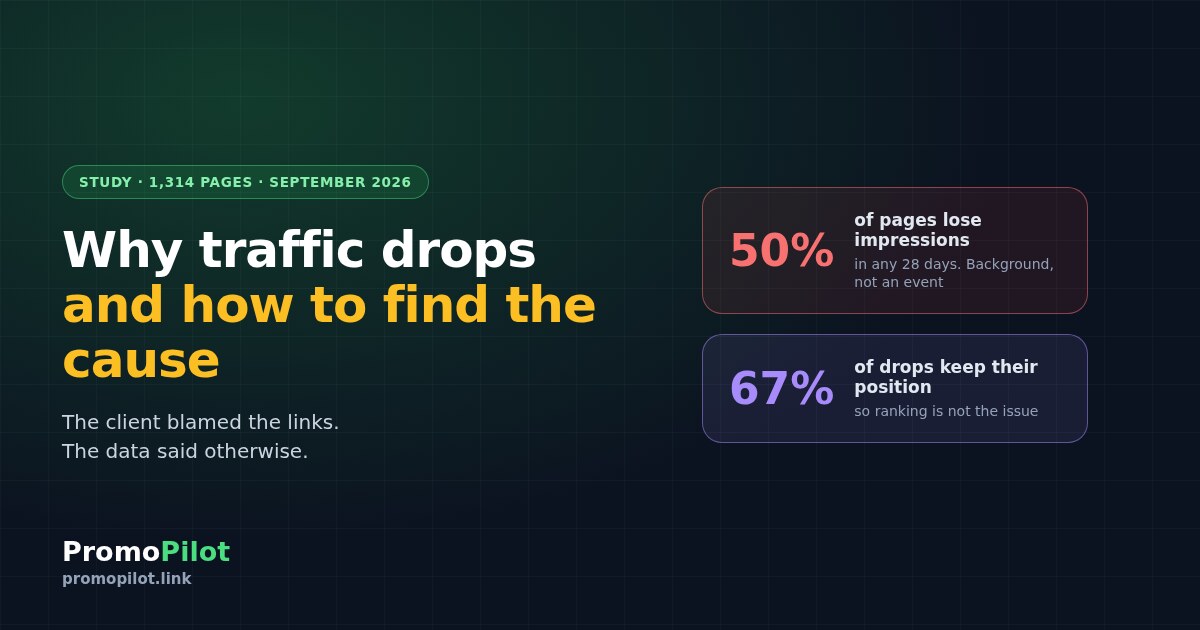
The result turned the question inside out. Yes, nearly a third of the promoted pages lost impressions — the client was seeing something real, nothing was imagined. But among comparable pages on the same sites over the same dates, half lost impressions. Median change: plus 14.0% for promoted pages against minus 9.7% for the rest. By total clicks: plus 9.5% against minus 20.3%.
In other words, a drop after a cascade happens less often than the ordinary background of the same site. The event the client read as a consequence is simply how almost any page on the internet behaves.
The mistake I made on this same data
Next I wanted to show readers that drops resolve on their own, so I traced what happened to pages across three consecutive 28-day windows. Of 319 pages with a complete history, 98 lost more than 20% of impressions in the second window. In the third, with no action taken, only 16.3% recovered, while 52.0% fell further.
A loud conclusion suggested itself: drops do not resolve, waiting is pointless. I almost sat down to write it — and then ran the symmetric check. I looked at the mirror group: what happens to pages that rose by more than 20% in the second window. They returned toward their starting level in 43.6% of cases — three times more often than fallen pages recovered.
That kind of asymmetry is never an accident, and the explanation showed up immediately: I checked the total across the whole cohort. Between windows it moved like this: 312,381 impressions, then 346,433, then 284,454. The third window came in 17.9% below the previous one — everything sank at once, and the fallen pages were "falling further" simply alongside everyone else.
The protocol: how to find the cause
What follows is six steps in the order they should be taken. The order is deliberate: the early steps filter out the cases where there was no drop at all, and only the last ones reach the algorithms that people blame first.
Establish that the drop exists
It sounds insulting, but a sizeable share of "collapses" are properties of the report, not of the site. Check in this order:
The most recent days are not fully counted yet. Google warns directly: "The newest data can be preliminary, meaning it's still being collected and might change in the next few hours". A dip in the last two or three days on the graph is almost always an artefact.
Chart and table totals legitimately differ. From the documentation: "The chart totals can sometimes differ from the table totals. This is usually due to differences in aggregation (property vs. page)". That is not an error and not a reason to hunt for missing traffic.
Property type and filters. A URL-prefix property only sees part of the site: protocol, subdomain and path all have to match. Moving from www to non-www without a domain property looks exactly like traffic vanishing.
The periods being compared. 28 days against 7 days is not a comparison. A week with a public holiday against an ordinary week is not either.
Work out whether position fell or impressions fell
This is the fork that saves weeks. We took 198 pages that lost more than 20% of impressions over 28 days and looked at what happened to their average position.
67.2% of the pages that fell did not lose position. They rank where they ranked — there are simply fewer impressions. That is an entirely different problem, and rewriting the text does not fix it: either the query is being asked less often, or the results page for it changed, or you stopped appearing for some of the queries.
Average position deserves a separate warning, because it misleads more often than any other metric. Google defines it as: "The position value shown in the Performance report is the topmost position occupied by a link to your property or page in search results, averaged across all queries". It is an average across queries, and the set of queries changes. Our data has a vivid case: in August there were more impressions than in July (64,545 against 58,629), while average position got worse — 21.9 against 16.2. Sites started appearing for new queries at distant positions, and that dragged the average down. Here a worse average position meant wider coverage, not a loss.
Separate demand from a ranking loss
If position holds and impressions fall, the next question is how many queries the page appears for at all. Query coverage shrank — you really did lose something. Coverage holds while impressions fall — demand dropped, or the results page itself changed.
In our sample, 113 of the fallen pages have coverage data. For 55.8% of them query coverage held: the page shows up for the same set of queries, just less often. For 44.2% coverage shrank by more than 15% — that is a genuine ranking loss, and it is handled differently.
Find where exactly it fell
"Site traffic fell" almost never means the site fell. We measured how clicks are distributed inside projects, and the picture is the same everywhere.
The median share of the strongest page is 29% of all clicks, and of the top three about 60%. At the same time more than half of the tracked pages get no clicks at all over 90 days. One simple thing follows: one page slipping draws a collapse of the whole site on the overall graph. So do not look for an explanation covering the site — find the page. In the pages report, compare two equal periods, sort by absolute click loss and look at the first five rows. The entire drop usually sits in one or two of them.
Tell a drop apart from a disappearance
Zero is not a small number, it is a different diagnosis. A page that had impressions and then stopped entirely has most likely fallen out of the index or become unreachable, and what needs checking is the technical side, not the content.
We measured how common this is too: of 413 pages with meaningful traffic, 22 went to exactly zero impressions over the last 28 days — 5.3%. Not many, but this is the case where the cause is found in five minutes and fixed completely.
Google files this under technical issues: "Technical issues are errors that can prevent Google from crawling, indexing, or serving your pages to users. For example, server availability, robots.txt fetching, 'page not found', and others".
And only now — algorithms
Google updates are real, but they are the last item on the list, not the first. Check them against the official Search status dashboard rather than industry blogs: the dates there diverge regularly.
Confirmed for 2026: the March spam update (19h 30m), the March core update (12 days 4h), the May core update (11 days 21h), the June spam update (2 days 1h), the August spam update (2 days 16h) and the September spam update, which is running right now with a stated window of up to two weeks.
AI results: what is true and what is a convenient excuse
"People no longer reach the organic results" is today's explanation number one for any drop. Let us go through the facts, because there is a lot of confusion here and very few verifiable details.
What Google documents outright. An AI answer block occupies a single position in the results, and every link inside it is assigned that same position: "An AI Overview occupies a single position in search results, and all links in the AI Overview are assigned that same position". Following an external link from the block counts as a click: "Clicking a link to an external page in the AI Overview counts as a click". Data on AI features is already part of the regular performance report, under the Web search type — it is neither hidden nor lost.
What follows from that. You cannot subtract "AI traffic" from the total, because it is not separated out. The dedicated generative report shows impressions only, with no clicks and no CTR. So the sentence "AI took my clicks" cannot be proven in Search Console even in principle — there is no metric there that would show it.
What our data showed. We took a fixed cohort of 1,314 pages with a complete five-month history — fixed deliberately, because the number of tracked pages grew fivefold over that period and any totals without that correction lie. Across this cohort CTR did not fall: 1.76% in May and 1.77% in September. There was no collapse in click-through in our projects over that time.
One more thing that removes a lot of unnecessary work. Google writes: "There are no additional requirements to appear in AI Overviews or AI Mode, nor other special optimizations necessary". There is no separate optimisation for AI answers — the requirements are the ones that always applied. We covered this in detail, with our own study, in a separate piece: how to get into AI answers.
What not to do
What we do about all this
Links are one factor, and our own check shows they do not cause drops. But we keep platform quality on measurements rather than convictions: for every platform in the pool we regularly collect the numbers — whether it gets indexed, whether it passes weight, what its own metrics look like. Priority is recalculated from that data, so the composition of the pool keeps changing and the platforms that actually work right now end up on top. A platform that stops being indexed moves down automatically, with no manual decision.
It is the same logic as the whole article: do not reason about what ought to work — measure what does, and always against a comparable group.
Frequently asked questions
How do I know traffic really fell rather than this being a quirk of the report?
Discard the last three days: Google marks fresh data as preliminary and it is still being counted. Make sure you are looking at a domain property rather than a URL-prefix one, clear all filters, and compare periods of equal length. A significant share of drops disappears at this step alone.
How long after launching links can the effect be judged?
No sooner than 28 days, and always against a control group of pages from the same site over the same dates. Without that comparison you are measuring the site's general background, not the effect of the links: in our data half of all pages lose impressions in any arbitrary month.
Traffic fell but positions held — does that happen?
It is the most common case. Among the 198 fallen pages in our sample, 67.2% did not lose position. That means ranking is not the issue: there were simply fewer impressions. Check query coverage, seasonality of demand, and changes in the kind of results page shown for your queries.
Could the drop be caused by AI answers, and how do I check?
You cannot check it directly: data on AI features is part of the overall performance report and is not broken out, while the separate generative report shows impressions only, with no clicks. There is one indirect check: compare CTR at an unchanged position across two periods. On our cohort of 1,314 pages CTR did not change over five months — 1.76% against 1.77%.
Should I change anything while a Google update is rolling out?
Better not. Edits made mid-rollout blend with its effect, and separating them afterwards is impossible. Record the start date, wait for the completion mark on the Search status dashboard, and only then compare equal periods before and after.
What should I do if a page went to zero impressions?
That is not a drop but a disappearance, and the diagnosis differs. Run the URL through URL Inspection in Search Console and look at the server response code, the noindex meta tag, a canonical pointing elsewhere, and robots.txt rules. In our sample 5.3% of pages disappeared this way — an uncommon case, but one that gets fixed completely and quickly.
Sources: Google Search Console Help (definitions of impressions and average position, preliminary data, chart versus table totals, how AI Overviews and AI Mode are counted), Google documentation on debugging search traffic drops and on AI features, and the official Google Search status dashboard. Own data: daily Search Console exports for client projects covering 28 April to 25 September 2026; client domains are not named.